 |
|
|
Modified HyTower 80-Meter Vertical (in the wind) |
Vertical Base and Radial System |
Analysis of the K3LR 80-Meter 2X4-Square Array Based Upon Measured Element Currents
On July 13, 2007, Tim, K3LR, Pete, N8TR, and Greg, W8WWV, used the rvm (Relative Vector Meter) software, in combination with the N2PK VNA and a custom RF multiplexer box, to measure element currents at the feed points of the K3LR 80-Meter 2X4-Square Array. The analysis on this page takes the complex (magnitude and phase) current data, and inserts it into an EZNEC (EZNEC+ V5.0) model. By combining measured current with an accurate physical model, the intent is to produce high accuracy antenna pattern data that reflects the reality of the current implementation.
To serve as reference points, the classic 4-Square and the WA3FET variation will be included in the analysis.
The K3LR 2X4-Square Array consists of two complete 80-meter 4-Square systems (8 total vertical antennas). The arrays, with some restrictions, can be used individually, or in a broadside combination (an end-fire combination is planned). Each vertical is based upon the HyGain 18HT HyTower design. The highly modified monoband result is 74 feet tall, and resonates at 3505 KHz. An extensive radial system is used, with each vertical located at the center of a 120 wire radial system, where each radial is 70 feet long, except when it is pointing within the 4-Square perimeter.
When looking down from above, the array has the following element locations, origin, and orientation.
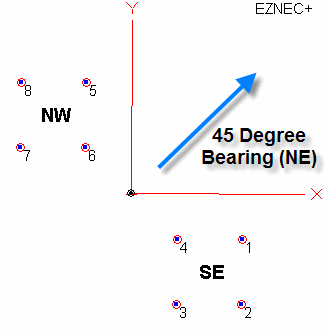 |
| 2X4-Square Element Locations and Orientation |
Each 4-Square face is 70 feet long. The center to center spacing between the arrays is 5/8 wavelength (168.5' @ 3650 KHz). These two metrics, along with the orientation, establish the locations of the 8 vertical elements. The southeast 4-Square is identified as the SE grouping, and the northwest 4-Square is the NW grouping. The origin of the model was selected to be the physical center point of the array combination. The EZNEC+ wire table used in this model is:
 |
| EZNEC+ Wire Table for the 2X4-Square Array |
For the purposes of this page, each vertical is modeled as a 2 inch in diameter aluminum wire which is 64.66 feet tall. This length was determined to be the resonant length (Z = 36 + j0 Ohms) for a single vertical at 3650 KHz. Other EZNEC modeling parameters include:
Element Length: 64.66'
Number of Segments: 22
Wire Loss: Aluminum
Ground Type: Real/MININEC
Ground Description: Medium (0.01, 14)
Plot Type: 3D, Step size: 2 degrees
A current (I) source is placed at the ground end of each vertical. The current values placed at the sources, combined with the physical description of the array, determine the array pattern and characteristics.
Each 4-Square uses a Comtek phasing network.
The effect of changing the element length from 64.66 feet to 74 feet is negligible. This is because we are working with nothing more than current into metal. At the top end of the element, the current has dropped to nearly zero in either length.
The current array implementation supports the following direction choices.
|
2X4-Square Direction Choices |
|
| Name | Description |
| 45 | The SE array firing in the 45 degree compass bearing. |
| 2X45 | Both arrays (NW and SE) fed in phase (broadside) and firing in the 45 degree compass bearing. |
| 135 | The SE array firing in the 135 degree compass bearing. |
| 225 | The NW array firing in the 225 degree compass bearing. |
| 2X225 | Both arrays (NW and SE) fed in phase (broadside) and firing in the 225 degree compass bearing. |
| 315 | The NW array firing in the 315 degree compass bearing. |
Current measurements were made at each array (SE and NW), and consisted of the 4 direction choices that the array participates in. At the end of the day, a single measurement was made that included an element (#4 and #6) from both arrays (acrosstwo). This purpose of this last measurement was to check that the two array groups indeed operate in-phase as a broadside system. Due to a lack of time, the measurement was made by simply extending the probe cables without performing a new calibration. Since the cables are known to be very similar (electrically), the results should be valid, but without calibration, we really are making assumptions on unsafe ground. The results collected, none the less, suggest that elements #4 and #6 had an approximate 10% current magnitude variation and an 8% phase variation. Ideally, the magnitudes would be the same, and the phase variation would be zero. Further measurements should be made to check the currents across the two arrays when they are being operated together as an array of arrays.
The ground distance between elements #2 and #8 is approximately 270', which presents a practical challenge to simply supply probe cables to all of the required places.
When both 4-Squares are used together, in the two broadside directions (45 and 225), elements #2, #4, #6, and #8 should all show the same current magnitude without any phase shift. Elements #1 and #5 should show the same current magnitude and zero phase shift, and be either lagging or leading the main diagonal depending upon the direction. Elements #3 and #7 should also show the same current magnitudes and phases, and be leading or lagging the main diagonal depending upon the direction.
For the purposes of this page, it will be assumed that the two arrays do indeed operate in phase when combined. This may or may not be the case.
The next table lists the measurements taken in the field.
|
2X4-Square Direction Choices |
||
| Name | Measured @ Array | Description |
| SE45 | SE | The SE array firing in the 45 degree bearing. |
| SE2X45 | SE | Both arrays (NW and SE) fed in phase (broadside) and firing in the 45 degree bearing. |
| SE135 | SE | The SE array firing in the 135 degree bearing. |
| SE2X225 | SE | Both arrays (NW and SE) fed in phase (broadside) and firing in the 225 degree bearing. |
| NW2X45 | NW | Both arrays (NW and SE) fed in phase (broadside) and firing in the 45 degree bearing. |
| NW225 | NW | The NW array firing in the 225 degree bearing. |
| NW2X225 | NW | Both arrays (NW and SE) fed in phase (broadside) and firing in the 225 degree bearing. |
| NW315 | NW | The NW array firing in the 315 degree bearing. |
| acrosstwo | SE&NW | Elements #4 and #6. |
In all cases, the array was driven from the center point, where the switching system can distribute the signal to either array, or both.
The switching system is designed to make an individual 4-Square array electrically invisible when it is not used. Measurements made in the field confirmed that there was no current flowing in an unused array. In the model, when an array is not in use, it's elements will be lifted off of the ground by 0.1 feet. This creates a 1/4 wavelength long element which is open at the bottom. This is the standard technique used to make a 1/4 wavelength element electrically invisible. In the actual implementation, a relay shorts the drive side of the 1/4 wavelength element feed line, which has the effect of creating a virtual open circuit at the element side.
The classic 4-Square configuration fires through an array corner. The front element has a relative current magnitude of 1 amp, with a lagging phase shift of -90 degrees. The two center elements have a magnitude of 1 amp, and a phase shift of 0 degrees. The rear element has a magnitude of 1 amp and a leading phase shift of +90 degrees. The following EZNEC Source Table expresses this phasing in the SE array, with the NW array inactive, and firing in the 45 degree bearing.
 |
| EZNEC+ Source Table for Classic 4-Square Phasing, SE Array, 45 degree bearing |
Since the desired currents are actually expressed as ratios (not absolute values), there are an infinite number of ways to say the same thing. In the case of the 4-Square, current magnitudes are usually expressed as 1, although 2, or 3.14, or any other value would be fine, just so long as all four are the same. When the current is specified as 1 amp, that usually means that it is the same as some reference value (also at 1 amp). The absolute current will be a function of the power level sent into the array, so it is of little value or interest (other than to determine the current ratio!). All current magnitudes used on this page are either set to 1, or measured relative to a reference of 1.
On this page, the nominal classic 4-Square current phases will be expressed as -90, 0, and +90. In other words, the center elements in the 4-Square will have a relative phase shift of 0, with a lagging phase element in the forward direction, and a leading phase element in the rearward direction. Other authors and designers may use a different set of relative phase relationships. For example, 0, 90, and 180, which is really the same as -90, 0, and 90. Another equivalent alternative that is sometimes used is -180, -90, and 0 degrees.
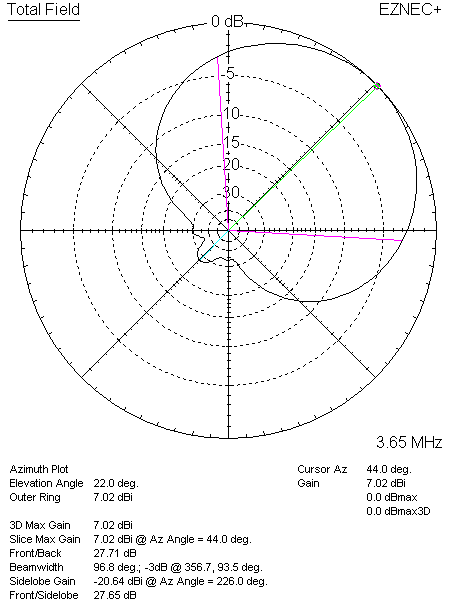
For the single 4-element classic 4-Square just presented, here are the azimuth and elevation pattern plots and data.
 |
 |
| Classic 4-Square Azimuth | Classic 4-Square Elevation |
The first interesting characteristic to note is that the pattern is not pointing exactly at a 45 degree azimuth (it is 44 degrees). This appears to be due to the presence of the second array, even though it is not driven (source current of zero), and the element is lifted off of the MININEC ground. The modeled results do indicate a small amount of current flowing in the second 4-Square (NW) even though the elements are supposed to be electrically invisible. Can we reconcile the small current flow shown in the model with the measured current flow which was claimed to be measured at zero? Here is the current report for element #6, which is the element in the NW array that is closest to the SE array.
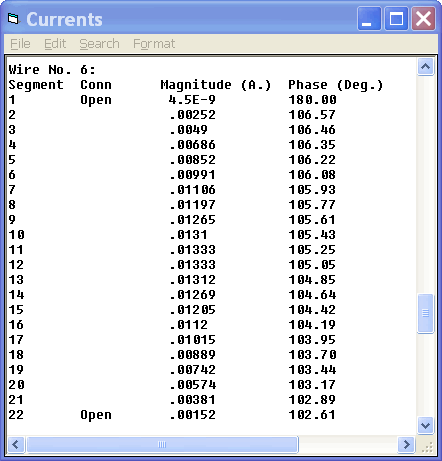 |
| Current in the Inactive Element #6 |
The current probe, which is the source of the measurement, is located at the base of the tower. It is at that point that zero current was measured. In the model, that would correspond most closely to the first wire segment. As the report shows, the current in the first segment is 4.5E-9 amps, which is 0.0000000045 amps - very little compared to the reference level of 1 amp. As we climb the vertical, however, the current actually rises, climbing to 0.01333 amps for this example element (segments 11 and 12. So, it is possible to have current in the invisible element, yet very little at the base.
It should also be pointed out that the model 3D plot step size will influence the reporting of this high resolution data. This is because EZNEC+ computes data only at the points specified on the 3D grid. The more points, the more data resolution and fine detail, although the longer it takes to compute results. In this case, the step size is set to 2 degrees. There is only one higher resolutions setting, 1 degree. But, that choice substantially slows the calculation time. At a 1 degree step size, the azimuth direction for this example is 43 degrees, and with a 3 degree step size, it is 42 degrees. The pattern rotation is definitely present. With a step size of 2 degrees, it will be impossible for the program to report a maximum at 45 degrees, since it is only considering 44 and 46 degrees. This tends to suggest that the step size should be 1 or 3, so that 45 degrees (and 135 and 225 and 315) are a calculation point. Although they have the desirable property of dividing evenly into 45, the step size of 2 will be generally used as an attempt to get the highest resolution data without slowing down the results to an unacceptable level. The azimuth bearing will be checked with 1 degree resolution.
The next step we take should be to perform a consistency check against an existing 4-Square model. The model presented on page 11-46 (section 4.7.1.1) of the 4th edition of ON4UN's Low-Band DXing will be used for comparison.
| Classic 4-Square Model Results Comparison | ||
| Criteria | This Model | Low-Band DXing |
| Max. Gain | 7.02 dBi | 6.67 dBi |
| 3-dB Beamwidth | 96.8 deg. | 98 deg. |
| RDF | 10.68 dB | 10.58 dB |
While the two are close, they are obviously not identical. The differences could be due to variations in the modeled elements, the ground type and description, the element spacing, or, perhaps, the fact that in our model we have a second 4-Square sitting off to side - inactive, but clearly having some small effect on the pattern.
One of the gripes with the classic 4-Square is that the rear lobe has a rather high take-off angle, approximately 60 degrees (see the previous elevation plot). Due to the use of 90 degree phase shifts, the null lies nearly along the ground, which is not a typical signal arrival angle. A phrase often heard is: increase the angle to raise the null. One of the variations which attempts to optimize the classic 4-Square is credited to Jim Breakall, WA3FET. The magnitudes and phases have been selected to raise the null and improve rearward response. Other aspects of the array are also improved, such as the gain, RDF (receiving directivity factor), and a lower take-off angle.
| Classic 4-Square versus WA3FET Current Phasing Values | ||
| Element | Classic | WA3FET |
| Forward Element | 1 amp @ -90 deg. | 0.97 amp @ -107 deg. |
| Center Elements | 1 amp @ 0 deg. | 1 amp @ 0 deg. |
| Rearward Element | 1 amp @ +90 deg | 1.11 amp @ +111 deg. |
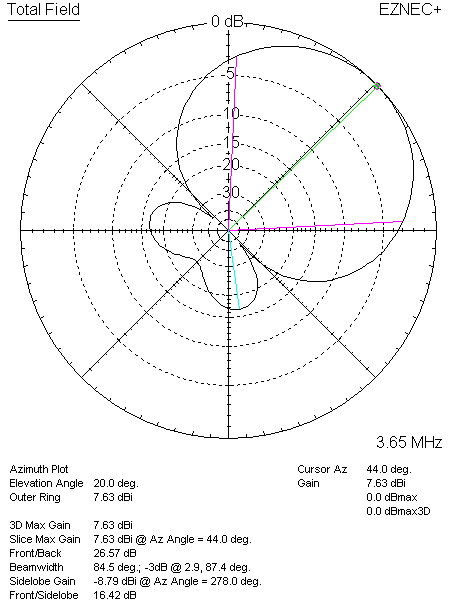
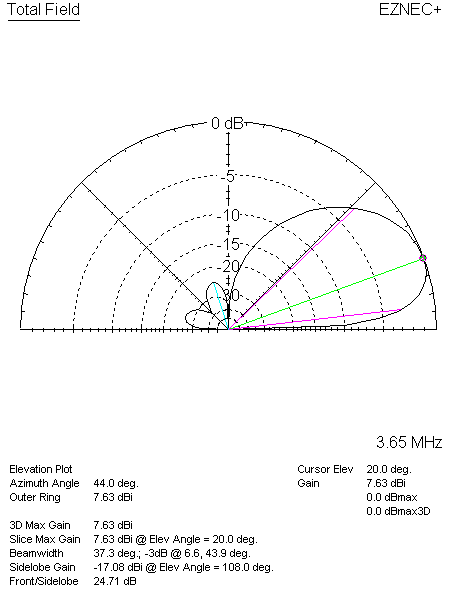
Here are the azimuth and elevation patterns of the WA3FET phasing in our model.
 |
 |
| WA3FET 4-Square Azimuth | WA3FET 4-Square Elevation |
The azimuth bearing of the main lobe is at 44 degrees, and the inactive elements exhibit a small amount of current. And as before, we can compare our model to the Low-Band DXing results.
| WA3FET 4-Square Model Results Comparison | ||
| Criteria | This Model | Low-Band DXing |
| Max. Gain | 7.63 dBi | 7.25 dBi |
| 3-dB Beamwidth | 84.5 deg. | 85 deg. |
| RDF | 11.43 dB | 11.4 dB |
The two are not in exact agreement, but are close - close enough to claim sanity. Although the gain and RDF do improve with the WA3FET variation, the main lobe narrows as compared to the classic 4-Square.
Both the classic and WA3FET 4-Squares are well-known configurations, and will be used as references for comparison to the measured data. This will be done for single array and combined array variations.
Perhaps the most interesting result of modeling these references as single 4-element 4-Squares within the 8-element K3LR model is to see that slight azimuth pattern rotation. This is the case even with the second array sources set to zero, and the elements lifted off of the ground, and 1 degree 3D step size in EZNEC+. In the next section, we will see if the measured data confirms this result.
Two different azimuth conventions are freely intermixed on this page. The first convention is the compass bearing convention, where north is assigned zero degrees, and increasing degrees move clockwise. This convention is usually used when thinking about navigating around the planet. The second convention assigns zero degrees to the rightward pointing X-axis, and degrees increase in the counterclockwise direction. This convention is often used by physicists and mathematicians, and is the default EZNEC+ convention. Although EZNEC+ does allow the selection of the convention, it has been left at the default setting since it is assumed that most users are familiar with the default.
The naming conventions for the array, such as SE135 and NW225, are based upon the compass bearing convention. 45 degrees just happens to imply the same direction on both systems.
In most cases, this convention confusion is not a problem, and the context clearly determines which system is in use. But, consider the slight pattern rotation previously discussed. A 44 degree angle in EZNEC+ is a 46 degree angle in the navigation convention.
It's finally time to introduce the measured data. Data was collected at a step size of 10 KHz from 3500 KHz to 4000 KHz. At each step, the data includes the transmission coefficient of the element, and the current ratio relative to the designated reference element. The current probes used at each element transform the complex element current into a complex voltage level which is measured by the VNA (vector network analyzer). The application software, rvm, is described on another page.
The 45 direction is the SE array by itself, pointing at an azimuth of 45 degrees.
The following two graphs show the current magnitude and phase ratio plots across the entire 80 meter band for the SE45 direction choice.
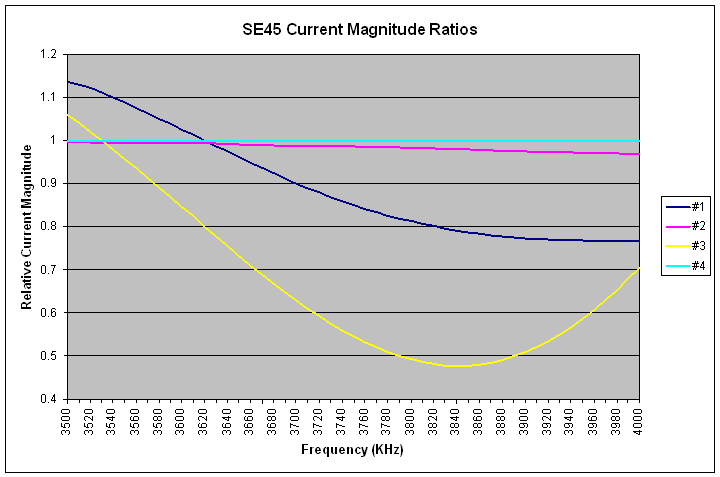 |
| SE45 Current Magnitude Ratios, Reference = #4 |
Since the classic 4-Square phasing was the target, an ideal implementation would show flat lines for all 4 elements, all at a magnitude of 1. In this measurement, element #4 was defined to be the reference, so it will be exactly on the specified value at all frequencies. The other 3 elements are reported relative to the reference. In this direction (45 degrees), elements #2 and #4 are the center elements. Element #2 tracks the target of 1 quite closely. Element #1 (forward) and #3 (rearward) start off above the target of 1, and then cross below the target as the frequency is increased.
|
|
|
SE45 Current Phase Ratios, Reference = #4 |
The phase targets are -90 degrees for the forward element #1, 0 degrees for center elements #2 and #4, and +90 degrees for rearward element #3. As in the case of the magnitude graph, the reference element, #4, will always be exactly the user-specified target. The other center element, #2, also hits the target of 0 degrees across the band.
For the purposes of this page, only 3 frequencies will be considered in detail - 3520 KHz, 3650 KHz, and 3780 KHz. For each frequency, we have to consider the 6 array direction choices. The classic and WA3FET modeled data will be added for reference.
|
45 Measured Relative Current Data |
||||||||
| F (KHz) | #1 | #2 | #3 | #4 | ||||
| mag. | deg. | mag. | deg. | mag. | deg. | mag. | deg. | |
| 3520 | 1.122 | -122.0 | 0.995 | -0.3 | 1.021 | 66.3 | 1.000 | +0.0 |
| 3650 | 0.961 | -130.1 | 0.990 | -0.4 | 0.731 | 64.1 | 1.000 | +0.0 |
| 3780 | 0.826 | -133.1 | 0.984 | -0.1 | 0.510 | 81.6 | 1.000 | +0.0 |
In each measured data set, one element is set to be the reference element, where all current magnitudes and phases are computed relative to the reference. In this first case, it is element #4, which always is indicated to have a magnitude of 1, and a phase of 0. Being the reference, it always appears to be perfect. As a convention, the reference is always one of the two center elements, which has a target current magnitude of 1, and a phase of 0 for the 4-Square.
| 45 Model Performance Based Upon Measured Currents | |||||||||
| Parameter | Frequency (KHz) | ||||||||
| 3520 | 3650 | 3780 | |||||||
| Measured | Classic | WA3FET | Measured | Classic | WA3FET | Measured | Classic | WA3FET | |
| Max. Gain | 6.95 dBi | 6.97 dBi | 7.63 dBi | 6.97 dBi | 7.02 dBi | 7.63 dBi | 7.26 dBi | 7.05 dBi | 7.62 dBi |
| F/B | 12.73 dB | 25.26 dB | 27.63 dB | 10.72 dB | 27.71 dB | 26.57 dB | 10.31 dB | 30.9 dB | 25.74 dB |
| RDF | 10.58 dB | 10.55 dB | 11.35 dB | 10.69 dB | 10.68 dB | 11.43 dB | 11.00 dB | 10.78 dB | 11.51 dB |
| AZ Angle | 44.0 deg. | 44.0 deg. | 44.0 deg. | 44.0 deg. | 44.0 deg. | 44.0 deg. | 44.0 deg. | 44.0 deg. | 44.0 deg. |
| EL Take-Off Angle | 22.0 deg. | 22.0 deg. | 20.0 deg. | 22.0 deg. | 22.0 deg. | 20.0 deg. | 20.0 deg. | 22.0 deg. | 20.0 deg. |
| AZ Beamwidth | 96.0 deg. | 98.7 deg. | 85.8 deg. | 91.4 deg. | 96.8 deg. | 84.5 deg. | 83.5 deg. | 95.1 deg. | 83.3 deg. |
The measured data, when inserted into the model, shows the same 44 degree azimuth angle found in the two reference models. This was true even when the 3D step size was set to 1 degree.
The modeled reference data tends to change very little across the three frequency points, whereas the measured data has a higher rate of change. For example, the AZ beamwidth on both the classic and WA3FET phasing changes no more than 3.6 degrees across the 260 KHz span. The measured beamwidth dropped by 12.5 degrees over the same span. This is hardly a surprise, since the only variable changing in the case of the references is the frequency, which is interacting with fixed length elements and fixed current ratios. The measured data, on the other hand, is based upon real components in the phasing networks, transmission lines, and elements, that are sensitive to frequency, and change the current ratios as a function of frequency.
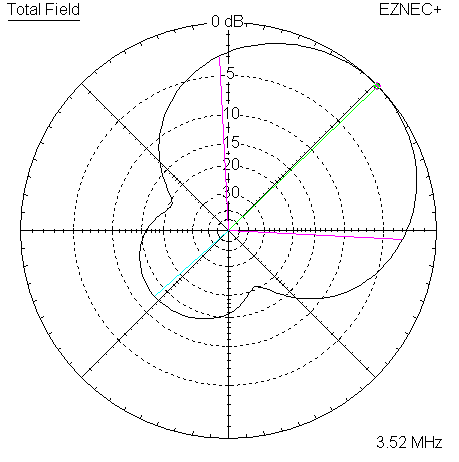
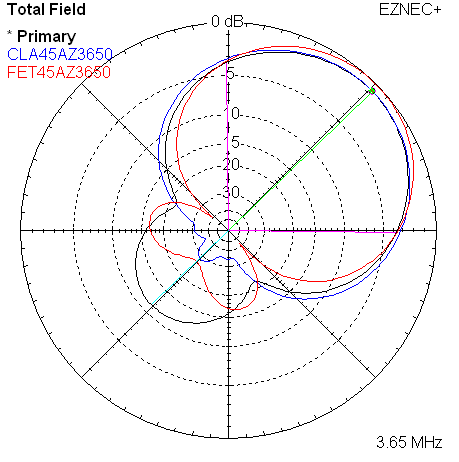
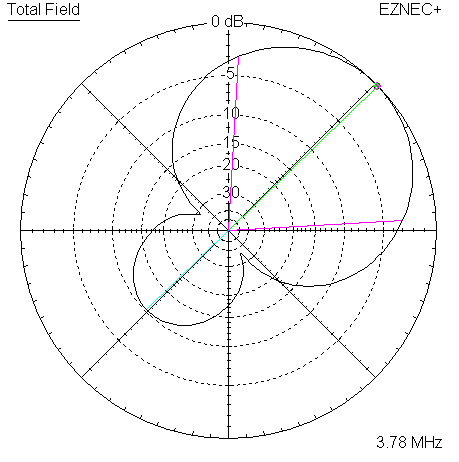
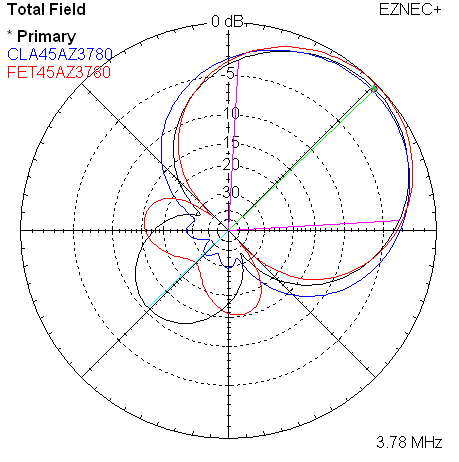
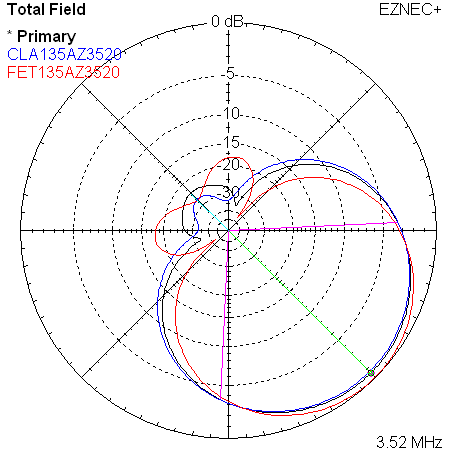
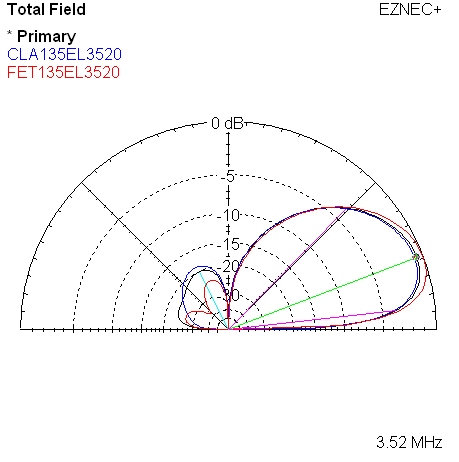
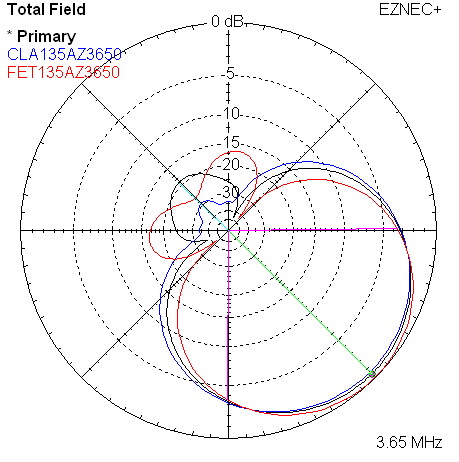
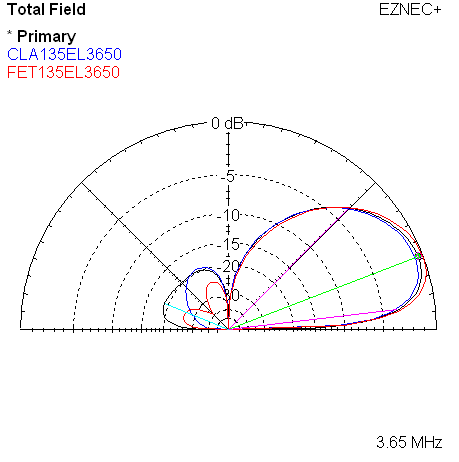
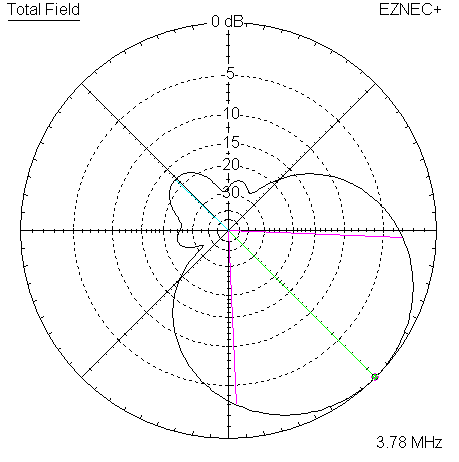
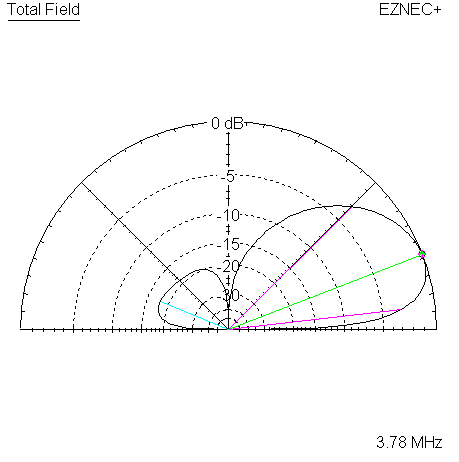
The most visible difference in the measured data is in the F/B ratio, which is approximately 12 to 15 dB lower in all cases as compared to the reference models. The rearward response difference shows up on the following pattern plots, generated for the 3 target frequencies.
 |
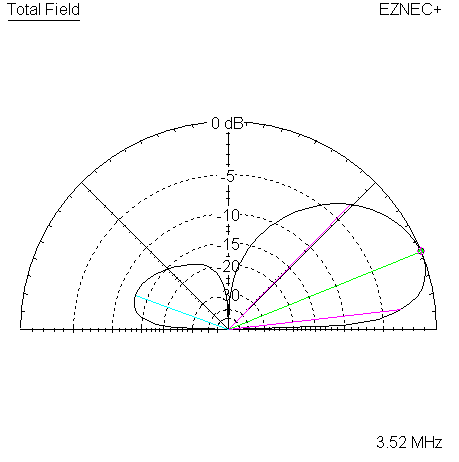 |
| Measured 45 Azimuth @ 3520 KHz | Measured 45 Elevation @ 3520 KHz |
The two plots overlay the reference models. Colors are used to distinguish the references, blue for classic, and red for WA3FET.
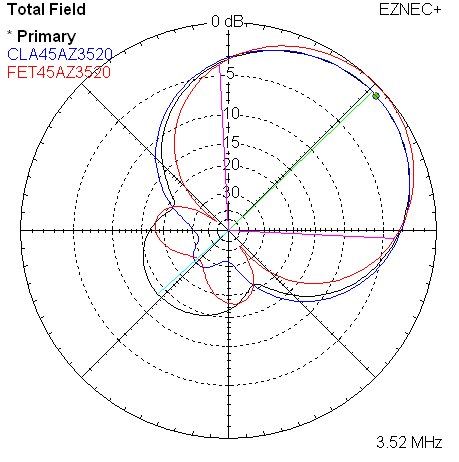 |
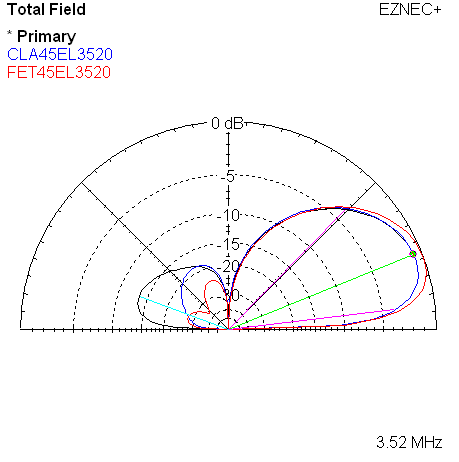 |
| Measured 45 Azimuth @ 3520 KHz w/References | Measured 45 Elevation @ 3520 KHz w/References |
The names such as CLA45AZ3520 are the names of saved trace data files. In this example, it indicates the classic model, 45 degree direction choice, azimuth plot, at 3520 KHz.
Here are the 4 corresponding plots for the 3650 KHz frequency.
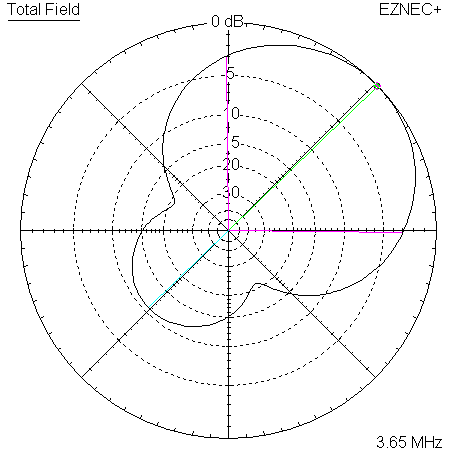 |
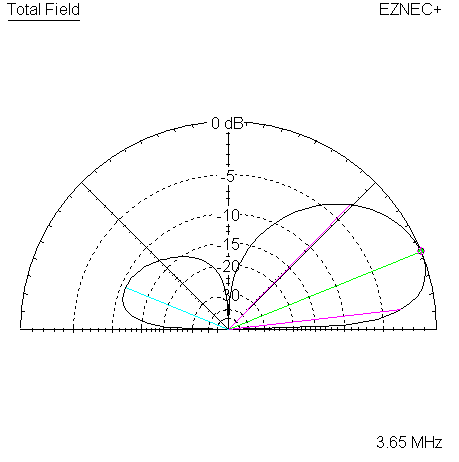 |
| Measured 45 Azimuth @ 3650 KHz | Measured 45 Elevation @ 3650 KHz |
 |
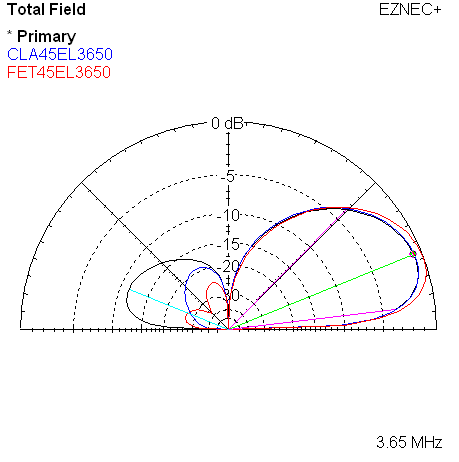 |
| Measured 45 Azimuth @ 3650 KHz w/References | Measured 45 Elevation @ 3650 KHz w/References |
Here are the 4 corresponding plots for the 3780 KHz frequency.
 |
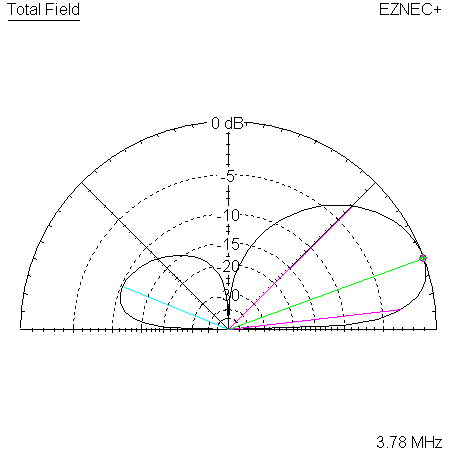 |
| Measured 45 Azimuth @ 3780 KHz | Measured 45 Elevation @ 3780 KHz |
 |
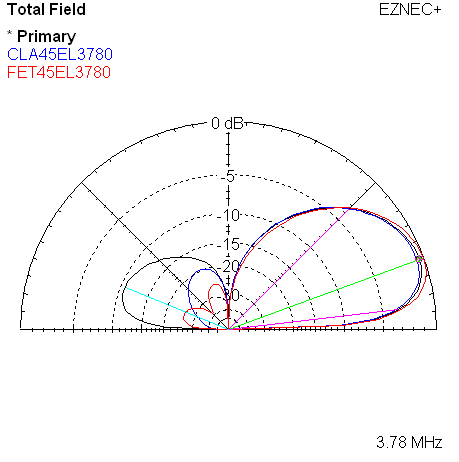 |
| Measured 45 Azimuth @ 3780 KHz w/References | Measured 45 Elevation @ 3780 KHz w/References |
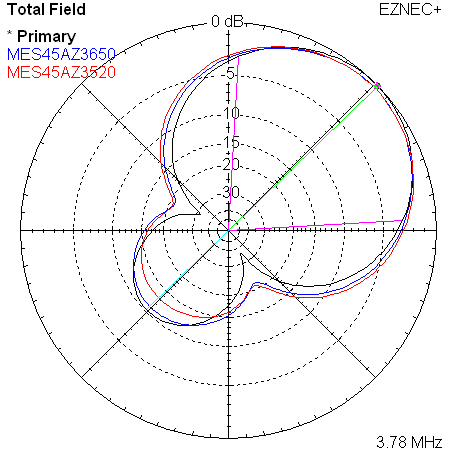
Finally, we can take just the measured data from the three frequencies, and overlay them onto a single set of azimuth and elevation plots.
 |
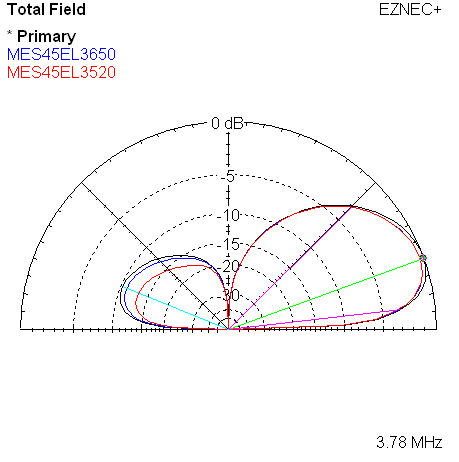 |
| Measured 45 Azimuth @ 3780, 3650, 3520 KHz | Measured 45 Elevation @ 3780, 3650, 3520 KHz |
The 2X45 direction uses both arrays, fed in phase with equal power, pointing at an azimuth of 45 degrees. For this direction choice, data was measured (independently) in both arrays. As previously described, they will be assumed to be in phase with each other. For each array, the magnitude and phase graphs as well as the numeric data at the three target frequencies will be presented.
 |
| 2X45 Current Magnitude Ratios (SE), Reference = #4 |
|
|
|
2X45 Current Phase Ratios (SE), Reference = #4 |
|
2X45 Measured Relative Current Data (SE) |
||||||||
| F (KHz) | #1 | #2 | #3 | #4 | ||||
| mag. | deg. | mag. | deg. | mag. | deg. | mag. | deg. | |
| 3520 | 1.082 | -114.0 | 0.996 | -0.6 | 1.035 | 74.5 | 1 | 0 |
| 3650 | 1 | -123.9 | 0.999 | -0.3 | 0.829 | 72.0 | 1 | 0 |
| 3780 | 0.903 | -127.2 | 0.984 | 0.4 | 0.630 | 85.0 | 1 | 0 |
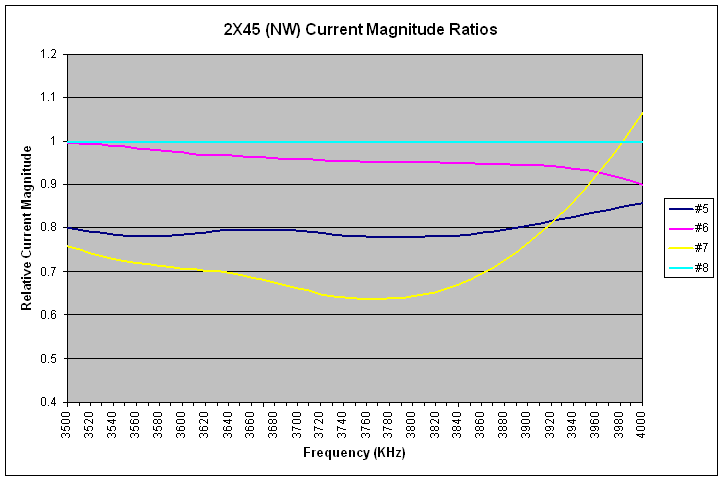 |
| 2X45 Current Magnitude Ratios (NW), Reference = #8 |
|
|
|
2X45 Current Phase Ratios (NW), Reference = #8 |
|
2X45 Measured Relative Current Data (NW) |
||||||||
| F (KHz) | #5 | #6 | #7 | #8 | ||||
| mag. | deg. | mag. | deg. | mag. | deg. | mag. | deg. | |
| 3520 | 0.792 | -112.7 | 0.994 | 0.5 | 0.743 | 83.2 | 1 | 0 |
| 3650 | 0.797 | -112.9 | 0.965 | 0.5 | 0.692 | 92.2 | 1 | 0 |
| 3780 | 0.782 | -115.8 | 0.953 | 0.6 | 0.638 | 107.5 | 1 | 0 |
PUT IN GRAPH COMPARING MAG AND PHASE BETWEEN SE45 IN THE TWO CONFIGURAATIONS.
| 2X45 Model Performance Based Upon Measured Currents | |||||||||
| Parameter | Frequency (KHz) | ||||||||
| 3520 | 3650 | 3780 | |||||||
| Measured | Classic | WA3FET | Measured | Classic | WA3FET | Measured | Classic | WA3FET | |
| Max. Gain | |||||||||
| F/B | |||||||||
| RDF | |||||||||
| AZ Angle | |||||||||
| EL Take-Off Angle | |||||||||
| AZ Beamwidth | |||||||||
The 135 direction is the SE array by itself, pointing at an azimuth of 135 degrees. This direction (as well as 315) is sometimes referred to as a pristine direction, since the other 4-Square is not only electrically invisible, but also physically off of the rear side of the active direction. This should be the configuration with the minimum interaction between individual 4-Square arrays.
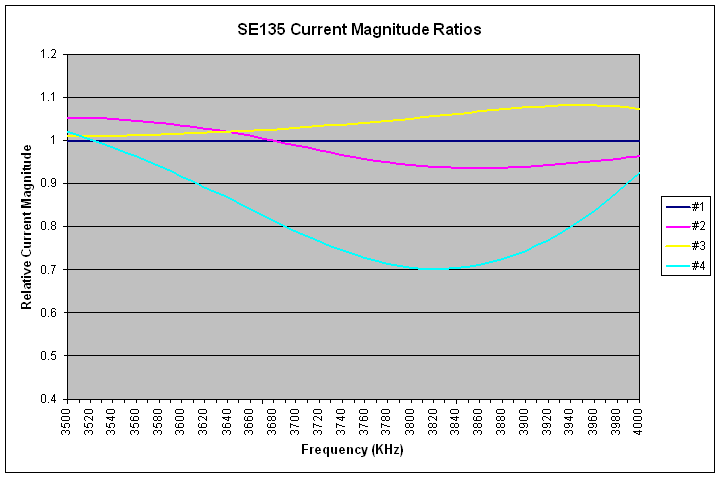 |
| SE135 Current Magnitude Ratios, Reference = #1 |
|
|
|
SE135 Current Phase Ratios, Reference = #1 |
|
135 Measured Relative Current Data |
||||||||
| F (KHz) | #1 | #2 | #3 | #4 | ||||
| mag. | deg. | mag. | deg. | mag. | deg. | mag. | deg. | |
| 3520 | 1 | 0 | 1.052 | -104.6 | 1.011 | 0 | 1.003 | 85.2 |
| 3650 | 1 | 0 | 1.016 | -112.7 | 1.022 | 0.2 | 0.855 | 84.4 |
| 3780 | 1 | 0 | 0.949 | -117.1 | 1.046 | -0.2 | 0.714 | 95.5 |
| 135 Model Performance Based Upon Measured Currents | |||||||||
| Parameter | Frequency (KHz) | ||||||||
| 3520 | 3650 | 3780 | |||||||
| Measured | Classic | WA3FET | Measured | Classic | WA3FET | Measured | Classic | WA3FET | |
| Max. Gain | 7.13 dBi | 6.95 dBi | 7.64 dBi | 7.25 dBi | 6.99 dBi | 7.63 dBi | 7.48 dBi | 7.02 dBi | 7.62 dBi |
| F/B | 22.88 dB | 25.59 dB | 26.86 dB | 18.52 dB | 28.72 dB | 25.81 dB | 17.78 dB | 32.48 dB | 25.01 dB |
| RDF | 10.74 dB | 10.53 dB | 11.36 dB | 10.94 dB | 10.64 dB | 11.43 dB | 11.26 dB | 10.75 dB | 11.51 dB |
| AZ Angle | 315 deg. | 315 deg. | 315 deg. | 315 deg. | 315 deg. | 315 deg. | 315 deg. | 315 deg. | 315 deg. |
| EL Take-Off Angle | 21.0 deg. | 22.0 deg. | 20.0 deg. | 21.0 deg. | 22.0 deg. | 20.0 deg. | 21.0 deg. | 22.0 deg. | 20.0 deg. |
| AZ Beamwidth | 95.6 deg. | 99.2 deg. | 85.6 deg. | 91.3 deg. | 97.2 deg, | 84.4 deg. | 85.2 deg. | 95.6 deg. | 83.2 deg. |
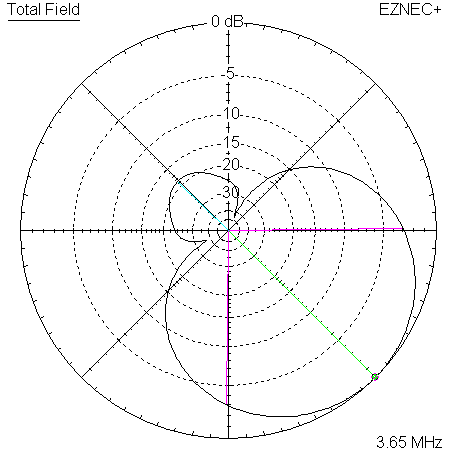
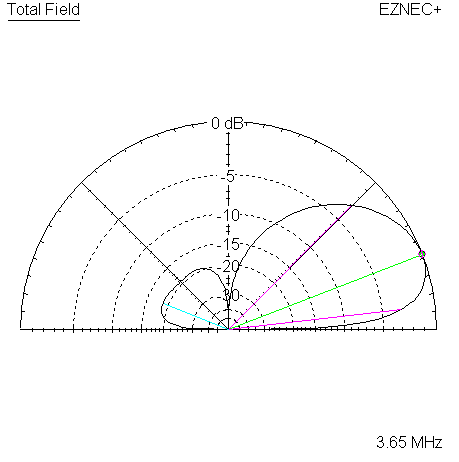
It is interesting to compare the classic and WA3FET references between the 45 direction and this 135 direction. It has been my experience that with a prefect model, changing the direction (assuming that all symmetry remains identical) has no effect on results. In this case, there are small differences between the references as a function of direction. While some of this could be due to the mixing of data taken from 1 or 2 degree step size 3D patterns, I do not believe that it is not the only factor. For example, the F/B ratio for the 45 direction, classic phasing, and 3780 KHz is 30.9 dB, whereas the same phasing and frequency at the 135 direction is 32.48 dB, a difference of 1.58 dB. The only factor that is asymmetric with respect to direction is the inactive 4-Square sitting off to the side. Small currents do flow in its open circuited 1/4 wavelength elements according to EZNEC+. It may be impossible to completely remove the parasitic effect of the second 4-Square when it is not in use.
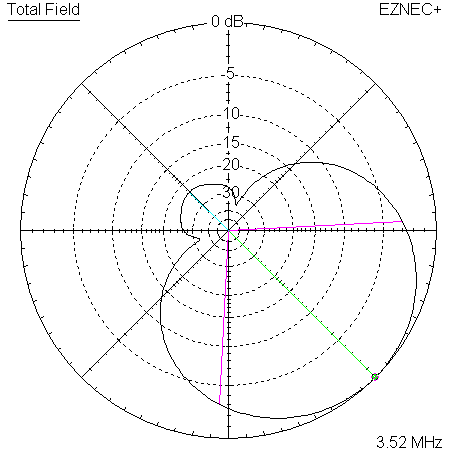
Begin with 3520 KHz pattern plots.
 |
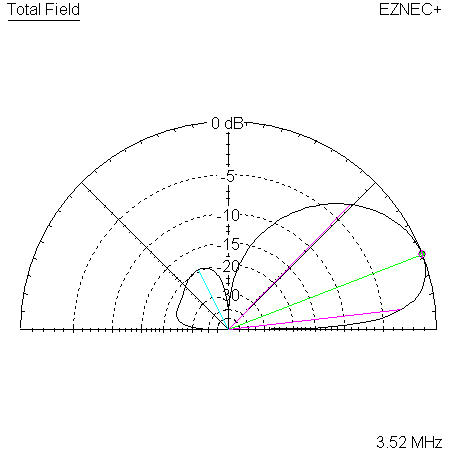 |
| Measured 135 Azimuth @ 3520 KHz | Measured 135 Elevation @ 3520 KHz |
 |
 |
| Measured 135 Azimuth @ 3520 KHz w/References | Measured 135 Elevation @ 3520 KHz w/References |
Shift to 3650 KHz.
 |
 |
| Measured 135 Azimuth @ 3650 KHz | Measured 135 Elevation @ 3650 KHz |
 |
 |
| Measured 135 Azimuth @ 3650 KHz w/References | Measured 135 Elevation @ 3650 KHz w/References |
Shift to 3780 KHz
 |
 |
| Measured 135 Azimuth @ 3780 KHz | Measured 135 Elevation @ 3780 KHz |
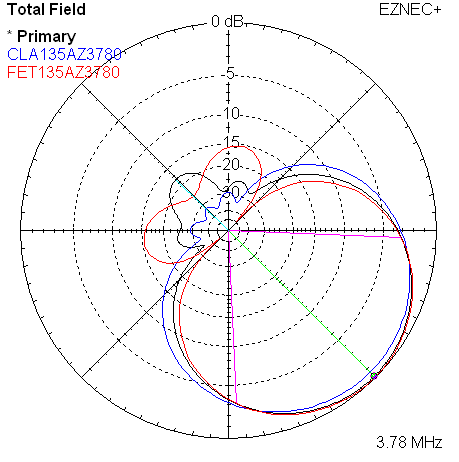 |
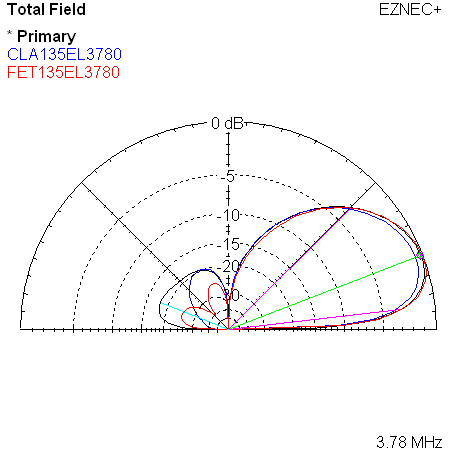 |
| Measured 135 Azimuth @ 3780 KHz w/References | Measured 135 Elevation @ 3780 KHz w/References |
The next plots take the measured data from the three frequencies, and overlay them onto a single set of azimuth and elevation plots.
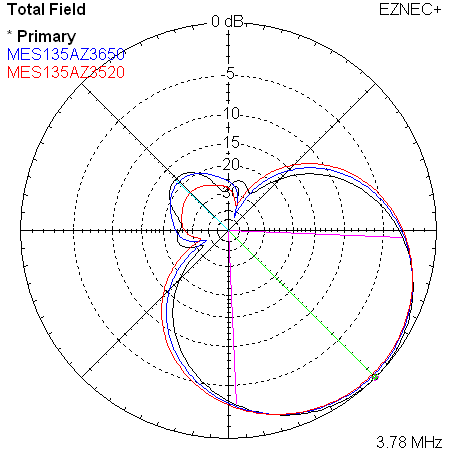 |
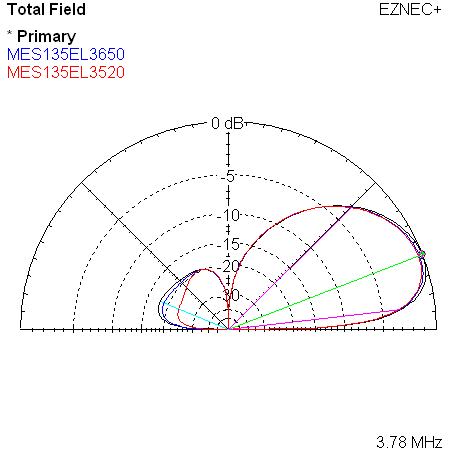 |
| Measured 45 Azimuth @ 3780, 3650, 3520 KHz | Measured 45 Elevation @ 3780, 3650, 3520 KHz |
The 225 direction is the NW array by itself, pointing at an azimuth of 225 degrees.
 |
| NW225 Current Magnitude Ratios, Reference = #6 |
|
|
|
NW225 Current Phase Ratios, Reference = #6 |
|
225 Measured Relative Current Data |
||||||||
| F (KHz) | #5 | #6 | #7 | #8 | ||||
| mag. | deg. | mag. | deg. | mag. | deg. | mag. | deg. | |
| 3520 | 0.893 | 83.8 | 1 | 0 | 0.978 | -107.3 | 0.999 | -0.5 |
| 3650 | 0.764 | 84.1 | 1 | 0 | 0.973 | -115.4 | 1.004 | -0.7 |
| 3780 | 0.612 | 96.7 | 1 | 0 | 0.924 | -121.5 | 1.016 | -0.3 |
| 225 Model Performance Based Upon Measured Currents | |||||||||
| Parameter | Frequency (KHz) | ||||||||
| 3520 | 3650 | 3780 | |||||||
| Measured | Classic | WA3FET | Measured | Classic | WA3FET | Measured | Classic | WA3FET | |
| Max. Gain | |||||||||
| F/B | |||||||||
| RDF | |||||||||
| AZ Angle | |||||||||
| EL Take-Off Angle | |||||||||
| AZ Beamwidth | |||||||||
The 2X225 direction is both arrays, fed in phase with equal power, pointing at an azimuth of 225 degrees. For this direction choice, data was measured in both arrays. As previously described, they will be assumed to be in phase with each other.
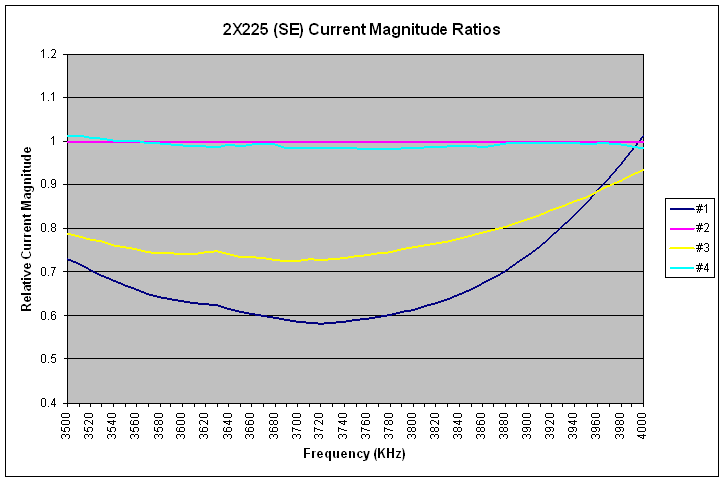 |
| 2X225 Current Magnitude Ratios (SE), Reference = #2 |
The data on this graph is not as smooth as on other graphs. It appeared that this was due to the gusty winds that were swirling around at the time of the measurement. See the picture of a vertical element at the start of this page for a sense of the movement in the upper part of an antenna. In this direction choice (2X225), all 8 elements are active.
|
|
|
2X225 Current Phase Ratios (SE), Reference = #2 |
|
2X225 Measured Relative Current Data (SE) |
||||||||
| F (KHz) | #1 | #2 | #3 | #4 | ||||
| mag. | deg. | mag. | deg. | mag. | deg. | mag. | deg. | |
| 3520 | 0.705 | 79.2 | 1 | 0 | 0.776 | -116.1 | 1.009 | 0 |
| 3650 | 0.609 | 91.9 | 1 | 0 | 0.736 | -115.5 | 0.988 | 0.1 |
| 3780 | 0.602 | 111.6 | 1 | 0 | 0.747 | -113.0 | 0.982 | -0.6 |
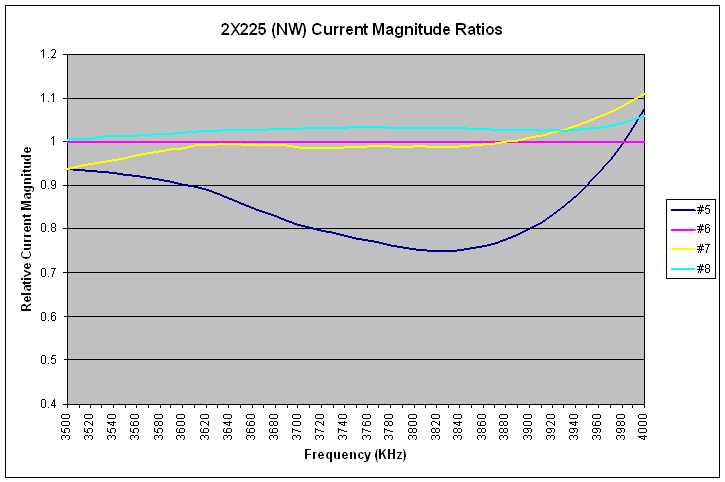 |
| 2X225 Current Magnitude Ratios (NW), Reference = #6 |
|
|
|
2X225 Current Phase Ratios (NW), Reference = #6 |
|
2X225 Measured Relative Current Data (NW) |
||||||||
| F (KHz) | #5 | #6 | #7 | #8 | ||||
| mag. | deg. | mag. | deg. | mag. | deg. | mag. | deg. | |
| 3520 | 0.933 | 88.3 | 1 | 0 | 0.948 | -102.9 | 1.008 | -0.9 |
| 3650 | 0.859 | 87.9 | 1 | 0 | 0.993 | -110.1 | 1.028 | -1.17 |
| 3780 | 0.763 | 98.6 | 1 | 0 | 0.988 | -115.2 | 1.033 | -0.8 |
| 2X225 Model Performance Based Upon Measured Currents | |||||||||
| Parameter | Frequency (KHz) | ||||||||
| 3520 | 3650 | 3780 | |||||||
| Measured | Classic | WA3FET | Measured | Classic | WA3FET | Measured | Classic | WA3FET | |
| Max. Gain | |||||||||
| F/B | |||||||||
| RDF | |||||||||
| AZ Angle | |||||||||
| EL Take-Off Angle | |||||||||
| AZ Beamwidth | |||||||||
The 315 direction is the NW array by itself, pointing at an azimuth of 315 degrees.
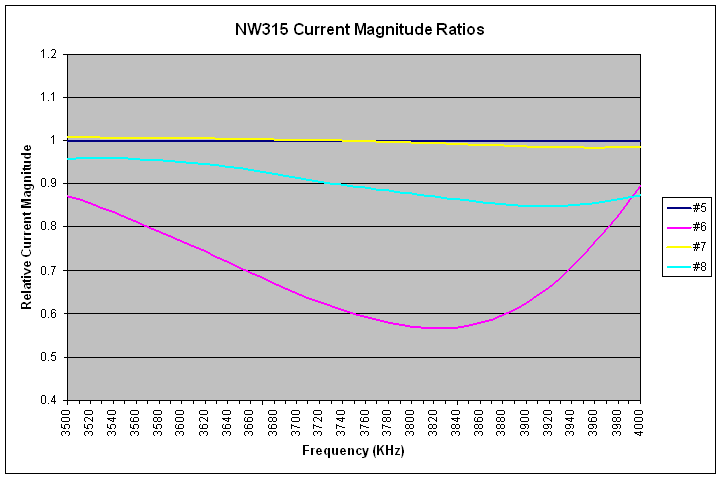 |
| NW315 Current Magnitude Ratios, Reference = #5 |
|
|
|
NW315 Current Phase Ratios, Reference = #5 |
|
315 Measured Relative Current Data |
||||||||
| F (KHz) | #5 | #6 | #7 | #8 | ||||
| mag. | deg. | mag. | deg. | mag. | deg. | mag. | deg. | |
| 3520 | 1 | 0 | 0.855 | 85.5 | 1.009 | 0.8 | 0.961 | -108.5 |
| 3650 | 1 | 0 | 0.707 | 88.5 | 1.005 | 1.0 | 0.937 | -115.6 |
| 3780 | 1 | 0 | 0.580 | 104.3 | 0.998 | 1.2 | 0.884 | -120.4 |
| 315 Model Performance Based Upon Measured Currents | |||||||||
| Parameter | Frequency (KHz) | ||||||||
| 3520 | 3650 | 3780 | |||||||
| Measured | Classic | WA3FET | Measured | Classic | WA3FET | Measured | Classic | WA3FET | |
| Max. Gain | |||||||||
| F/B | |||||||||
| RDF | |||||||||
| AZ Angle | |||||||||
| EL Take-Off Angle | |||||||||
| AZ Beamwidth | |||||||||
It's always tempting after looking at a lot of data to ask the question - what would we change if we could change something?
XXXX
Back to my Experimentation Page